
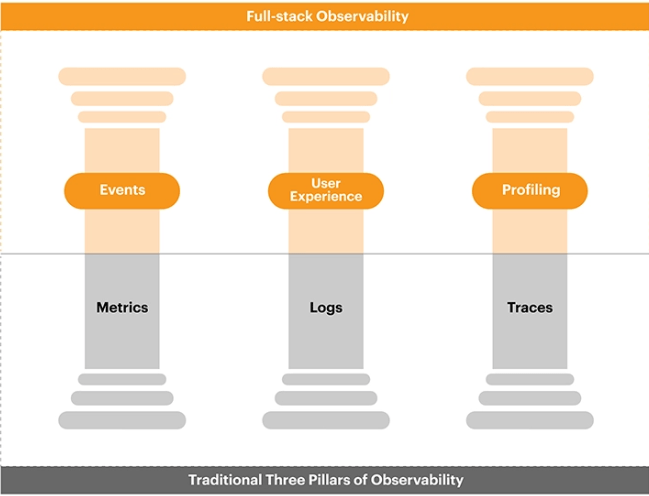
Observability refers to the ability to understand and infer the internal state of a system based on its external outputs. In simpler terms, it’s about gaining insights into how a system behaves and performs by observing its outputs, such as logs, metrics, and traces. Unlike monitoring, which focuses on collecting data passively, observability emphasizes active exploration and understanding of system behaviors. It involves collecting and analyzing diverse data sources to provide a comprehensive view of system health, performance, and behavior. Observability relies on telemetry data, which includes metrics for quantifiable measurements, logs for detailed event information, and traces for understanding transaction flows across distributed systems. By correlating and analyzing these data sources, observability enables engineers to diagnose issues, troubleshoot problems, and optimize system performance effectively.
The benefits of observability are manifold. Firstly, it enhances system reliability by providing real-time insights into system behavior and performance anomalies, allowing engineers to proactively identify and address issues before they escalate. Secondly, observability facilitates faster incident response and resolution by enabling engineers to pinpoint the root cause of problems accurately. Thirdly, it supports efficient capacity planning and resource optimization by providing visibility into resource utilization trends and performance bottlenecks. Some of the most important use cases of observability include monitoring microservices architectures, troubleshooting distributed systems, optimizing cloud infrastructure performance, and ensuring application reliability in dynamic environments.

Implementing observability involves several key steps. Firstly, organizations need to instrument their systems to collect relevant telemetry data, including logs, metrics, and traces. This often involves integrating observability tools and libraries into applications and infrastructure components. Secondly, organizations must centralize and aggregate telemetry data from across their distributed systems to gain a unified view of system behavior. This may involve deploying observability platforms or using cloud-based monitoring services. Finally, organizations need to analyze and visualize telemetry data effectively to derive actionable insights and drive informed decision-making. This may involve leveraging advanced analytics techniques, machine learning algorithms, and visualization tools to extract meaningful patterns and trends from telemetry data.
Observability is also becoming integral to DevOps practices, where it plays a crucial role in enabling continuous monitoring, feedback, and improvement throughout the software development lifecycle. In DevOps, observability tools and practices facilitate rapid detection and resolution of issues, streamline deployment pipelines, and optimize application performance. Examples of observability tools in DevOps include monitoring and logging solutions like Prometheus, Grafana, ELK Stack (Elasticsearch, Logstash, Kibana), which provide insights into application performance, infrastructure metrics, and logs, helping DevOps teams identify bottlenecks, troubleshoot issues, and improve overall system reliability and resilience.
Future trends in observability are poised to revolutionize the way organizations manage and monitor their systems, with a significant focus on automation and intelligence. Artificial Intelligence (AI) and Machine Learning (ML) will play a pivotal role in this evolution, enabling advanced analytics and predictive capabilities. AI/ML algorithms can analyze vast amounts of telemetry data to identify patterns, anomalies, and trends that might elude manual analysis. By leveraging AI-driven anomaly detection and forecasting, organizations can proactively identify and address potential issues before they impact system performance or reliability. Moreover, AI-powered incident response and remediation processes can automate the resolution of common issues, reducing the burden on human operators and minimizing downtime.
In the realm of multi-cloud and hybrid cloud environments, observability solutions will need to adapt to the complexities of managing distributed architectures across multiple cloud providers. Organizations increasingly rely on a mix of public cloud, private cloud, and on-premises infrastructure, making it challenging to gain a unified view of system health and performance. Observability tools tailored for multi-cloud environments will enable organizations to aggregate and analyze telemetry data from disparate sources, providing comprehensive insights into system behavior across the entire hybrid infrastructure. Examples of tools and services in this trend include cloud-native monitoring platforms like Datadog, New Relic, and Dynatrace, which offer support for multi-cloud environments and provide centralized visibility and analytics capabilities.
The proliferation of edge devices, driven by trends such as the Internet of Things (IoT) and edge computing, presents new challenges and opportunities for observability. Edge devices operate in diverse and often resource-constrained environments, making traditional monitoring approaches insufficient. Observability solutions for edge computing must be lightweight, scalable, and capable of processing telemetry data locally to provide real-time insights and enable proactive management. Tools like AWS IoT SiteWise, Azure IoT Hub, and Google Cloud IoT Core offer capabilities for monitoring and managing edge devices, providing visibility into device performance, health, and security metrics.
In conclusion, observability is becoming increasingly crucial in modern software engineering practices, particularly in the context of distributed, cloud-native architectures. As systems become more complex and dynamic, the ability to understand and troubleshoot system behavior in real-time becomes paramount.
